Scary Chart Number Eleven:
That Marijuana You're Still Smoking? See what it's doing to you.
 |
| From the National Institute on Drug Abuse |
Scary Chart Number Ten:
Five Leading Causes of Deaths Among Persons Ages 15–19 Years,
United States, 2010
 |
| Center for Disease Control |
Scary Chart Number Nine:
If the US had 100 People and $100 total Wealth
 |
| From All My Eyes |
Scary Chart Number Eight:
How Fracking for Natural Gas has Impacted Earthquake Frequency in the Central and Eastern US
 |
| From Greenpeace |
Scary Chart Number Seven:
 |
| From the Sentencing Project |
Scary Chart Number Six:
Nearly Half of Americans in Favor of Torture
 |
| From the Economist |
Scary Chart Number Five:
Where your Plastic Water Bottles and Plastic Grocery Bags End Up
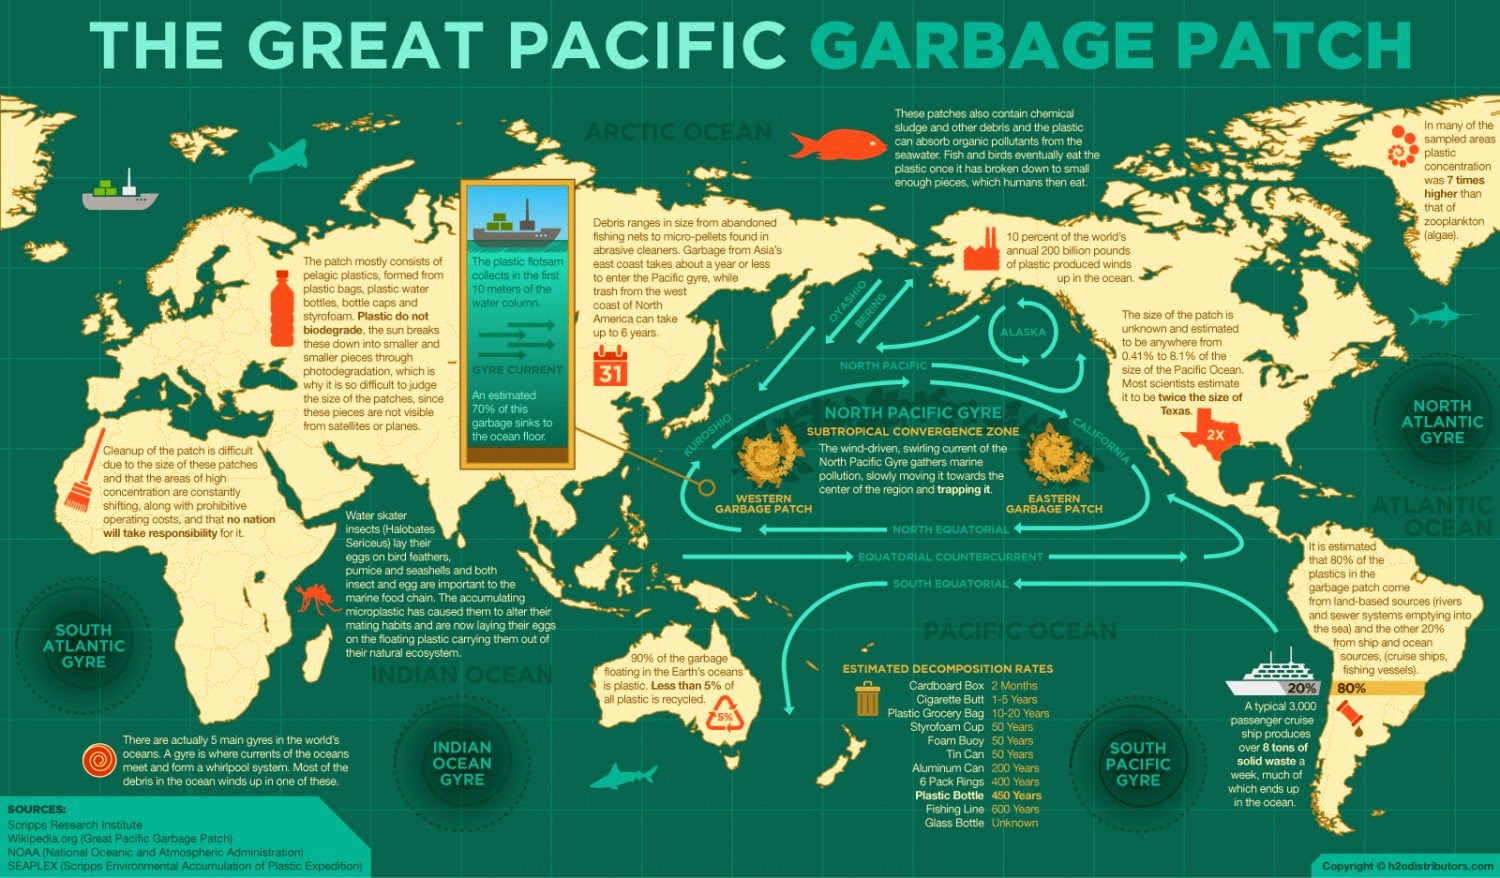 |
| From H2O Distributors |
Scary Chart Number Four:
 |
| From International Sanctuary |
Scary Map Number Three:
How Many Metric Tons of Nuclear Waste does Your Family Sleep Next to?
| From NEI (Nuclear Energy Institute) |
Scary Chart and Map Number Two:
Hate is on the Rise -- and Probably Not Far from Where You Live
 |
| From ABC News: Hate Groups on the Rise in US |
 |
| From the Southern Poverty Law Center |
And The Scariest of All, Showing Our Very Own Planet Last Year:
 | ||||||
| From the National Oceanic and Atmospheric Administration: Global Climate Report |
Comments
Post a Comment
I'm interested in your comments.